Check Out This API On Quandl »
Volatility measurements provide insight as to the actual or expected variation in the price of a stock over a given period of time. This data set provides both historical and implied volatilities.
Historical Volatility
Historical volatility is the measure of actual price movement for the stock in the past. There are several ways to calculate historical volatility, and this data set provides the two most popular methods:
- Close-to-close volatility (“Hv”, such as Hv10, etc) is calculated using the closing price of the stock on each trading day for a calendar period leading up to the most recent trading close.
- Parkinson volatility (“Phv”, such as Phv10, etc) is calculated using the high and low prices of the stock on each trading day for a calendar period leading up to the most recent trading close.
The numbers in each volatility field represent a duration in calendar days. For example, Hv30 indicates the historical close-to-close volatility for approximately 30 calendar days, Phv180 indicates the historical Parkinson volatility for approximately 180 calendar days, and so on.
For more details, please see the historical volatility page.
Implied Volatility
Implied volatility is the projected future volatility of a stock inferred from the prices of its options. For full details on how we calculate these values, please see the implied volatility page.
Volatility Skew
Implied volatilities for the same expiration period vary across the different strike prices. In general, the shape of the graph of implied volatilities against strikes takes the form of a “skew” or “smile” where the implied volatilities are highest for the lowest strike prices and slope downward to reach a low near the money. Then, depending on market sentiment, the implied volatilities may slope further up, down, or even stay flat. When the skew slopes upward after the ATM strike, it may be a sign of bullishness for that time horizon. When the slope continues downward, it may indicate bearish sentiment. A flat skew may indicate neutral sentiment. However, the interpretations of these skews may vary depending on the stock and other market conditions.
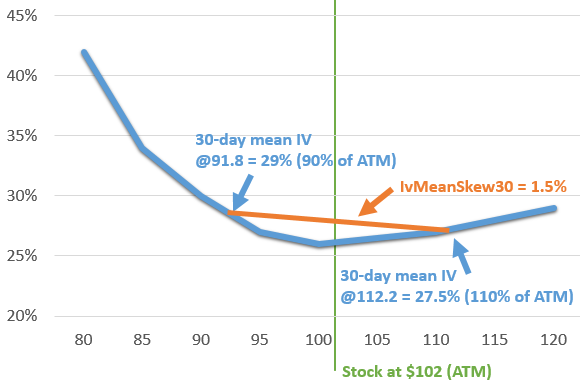
One of the best ways to measure the state and change in skew for a given stock is to look at the skew’s steepness as it pertains to options straddling the money. This data set provides the skew steepness for each of the implied volatility durations by subtracting the mean implied volatility of the call and put options with strikes at 110% of the money from the mean implied volatility of the call and put options with strikes at 90% of the money.
For example, suppose a stock is trading at $102 and its 30-day implied volatilities are being analyzed. Its 90% of ATM strike is $91.80 and has an implied volatility of 29%. Its 110% strike is $112.20 and has an implied volatility of 27.5%. Subtracting 27.5% from 29% would give the skew steepness of 1.5% for this particular scenario.
f