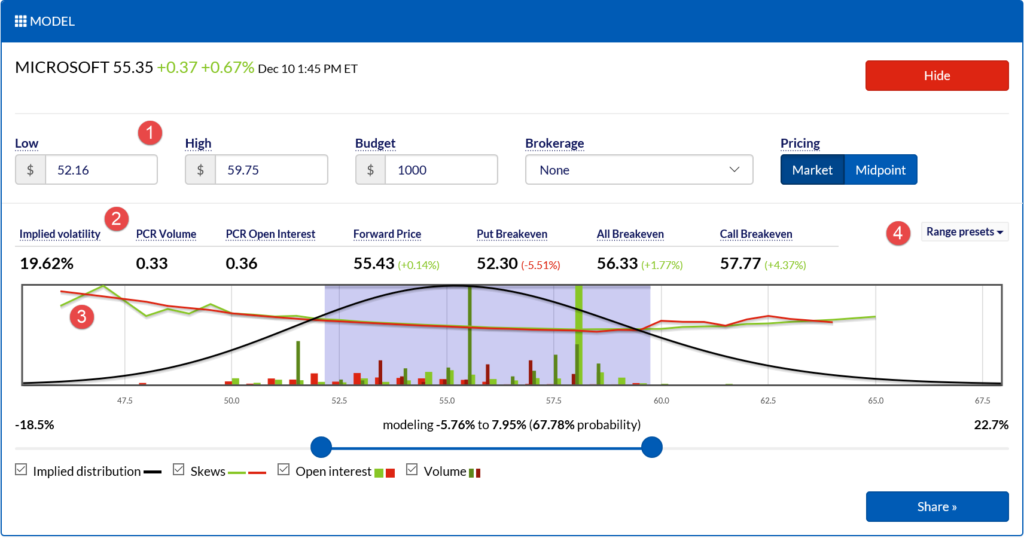
The model designer gives you a robust utility for crafting a market view for your target stock. You’ll get access to a wealth of information about the latest trading sentiment for the stock and its options at this expiration.
Model Designer

By default the model designer is in its collapsed mode. This mode provides a brief overview of the model currently in place, including:
- A market quote for the underlying
- The price range to model the underlying at by the expiration date
- The maximum budget (debit cost or credit risk) for trades to consider and optimize for
- The brokerage to price in fees and commissions
- The pricing mode
- A button to share this page
The default view for an expiration is based on a combination of factors that approximate the prevailing market view of the underlying at expiration. These factors include the current price of the underlying, the anticipated dividends between now and expiration, the implied volatility for this expiration, and a few others. The default view is neutral and uses a one-standard-deviation move down and up as its price target. To customize this view, simple click on any of the dashed links in the model designer.

When the model designer expands:
- You have the ability to edit the key fields, such as the price target range, manually.
- You are presented with key option analytics for this expiration, including the implied volatility, put/call ratio, forward price, and option breakevens.
- You can select a price target range using the visual option chain.
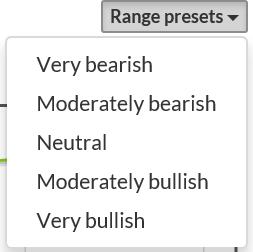
- You can select a price range based on a range preset.
Range Presets

There are five range presets that make it easy to quickly select a price target range based on your view of the underlying. For example, consider a stock trading at $55.35 with a 6-week implied volatility of around 20%. The presets would produce pricing similar to the following for a 6-week expiration:
| Preset | Range in standard deviations | Price range |
|---|---|---|
| Very bearish | -1.5 to -0.5 | 48.32-53.53 |
| Moderately bearish | -1 to 0 | 51.72-55.35 |
| Neutral | -1 to +1 | 51.72-59.27 |
| Moderately bullish | 0 to +1 | 55.35-59.27 |
| Very bullish | +0.5 to +1.5 | 57.29-63.45 |
Note that anticipated dividends are extracted from the pricing model. As a result, if a $100 stock were distributing $1 between now and the target expiration, the “0” movement price would actually be at $99 to account for the leakage. Since options holders do not have dividend rights, bullish positions are negatively impacted by dividends (and bearish positions are positively impacted).
Visual Options Chain
The visual options chain provides an in-depth view for the options trading at this expiration, including skews, volume, and open interest. You can learn more about it on the visual option chain page.
When you’re done refining your model, be sure to press the Apply button to update the modeling.