The trade analyzer provides an in-depth review of the trade from multiple perspectives.
Risk-Neutral Trade Review
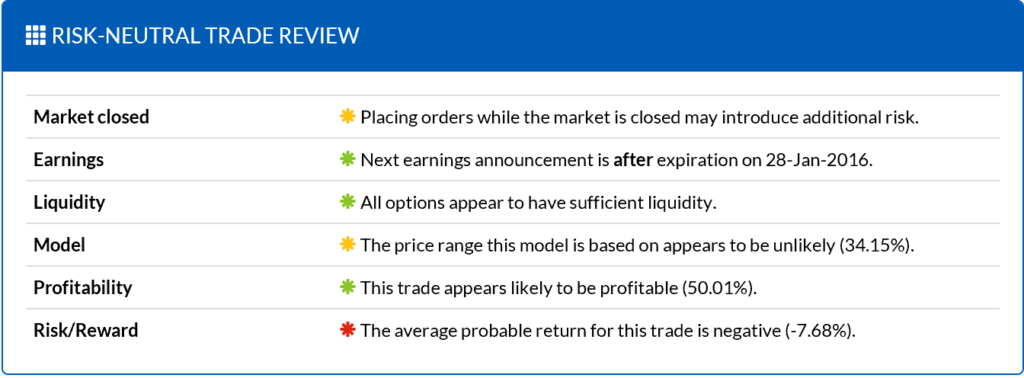
The Risk-Neutral Trade Review panel provides a brief summary of the things you should be aware of before placing the trade. Depending on your profit goals and risk tolerance, some items may carry more importance than others. When an item is marked with a green asterisk, it generally indicates that a particular aspect of the trade is favorable from a risk-neutral perspective. Yellow asterisks indicate that the given aspect is either unfavorable or requires careful consideration. Red asterisks are warnings regarding significant risks.
| Item | Explanation |
|---|---|
| Market closed | The market is currently closed. Placing orders when the market is closed can introduce additional risk. |
| Unlimited risk | The trade involves a net naked short (stock or call) position. |
| Short stock | The trade is short stock. |
| Naked puts | The trade is net naked short puts. If the trade is secured, then the strike price per share is used as the investment basis. Otherwise the naked put margin requirement is. |
| Earnings | The next earnings announcement (if known) relative to the trade’s expiration. |
| Dividend | The next ex-dividend date (if applicable/known) relative to the trade’s expiration. |
| Liquidity | Warns if any of the legs involve illiquid options. |
| Model | Evaluates the model’s expected likelihood of accuracy based on the implied distribution. |
| Profitability | Evaluates the likelihood of profit across the implied distribution. |
| Risk/Reward | Evaluates the likelihood and size of potential profits vs. loss. |
| Hard to borrow | Warns if the underlying appears to be hard to borrow based on a forward price for this expiration reflecting a 10%+ discount (ex-dividends). |
| Budget | Warns if the analyzed trade requires a minimum investment beyond the configured budget. |
Trade Legs
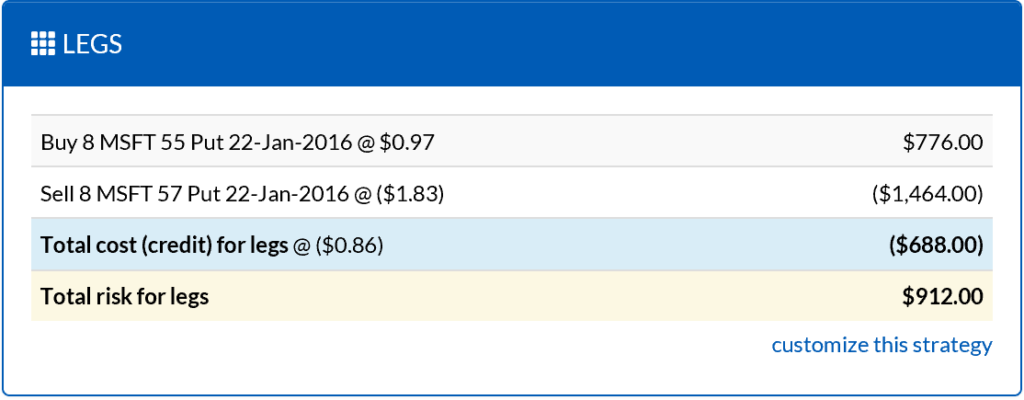
The Legs panel displays the quantity of each leg of the analyzed trade optimized for the available budget. It also includes the pricing details used to model the trade.
Cost & Risk
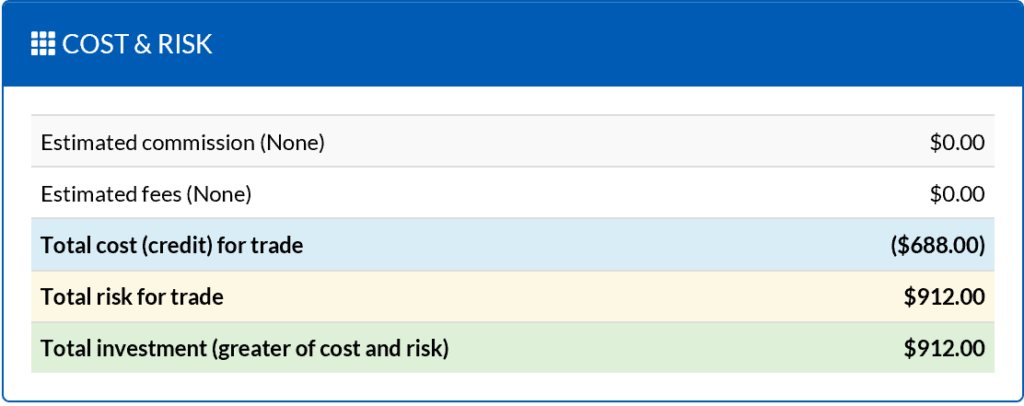
The Cost & Risk panel breaks down the cost/credit and investment basis of the trade, as well as the expected fees and commissions.
Model Analysis
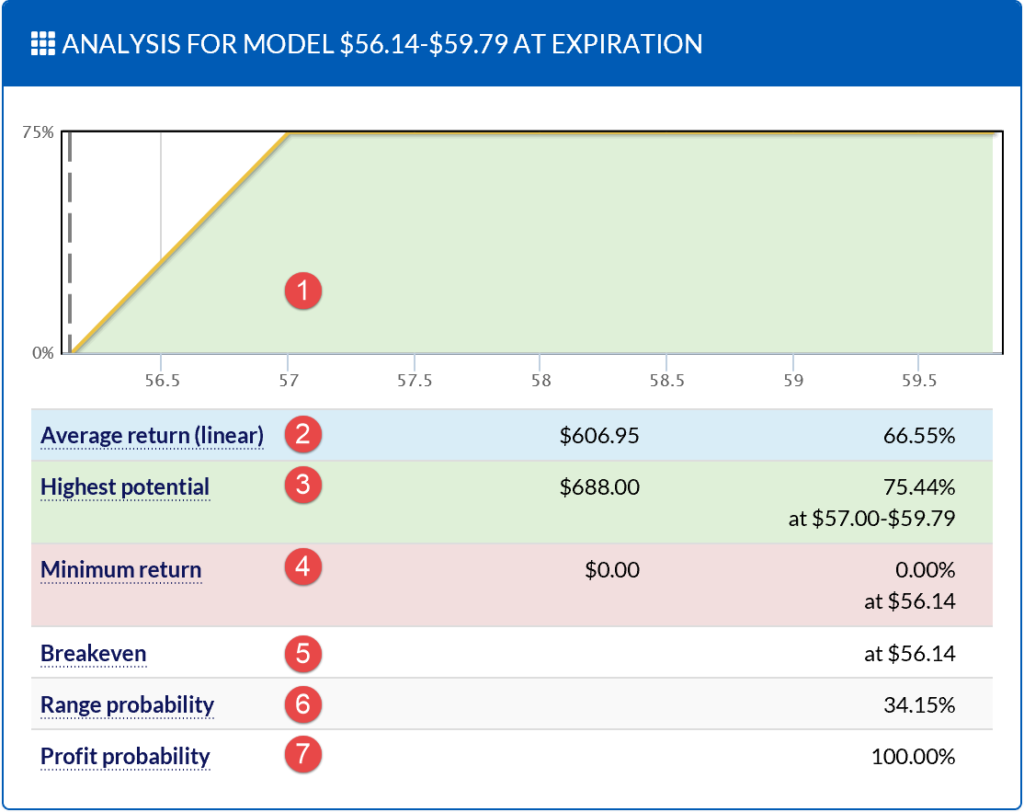
The Model Analysis panel analyzes the expected performance of the trade at expiration for the modeled price range. Note that this analysis is based on intrinsic value and does not take into account extraordinary circumstances, such as early option assignment.
- The profit and loss chart.
- The weighted return for the modeled range. All prices are weighted based on their relative probability.
- The highest potential return for this model.
- The lowest potential return for this model.
- The breakeven points within this model, if any.
- The likelihood that the underlying will close in the model range based on the implied distribution.
- The likelihood of profit for this trade if the underlying closes within the model range.
Full Implied Analysis
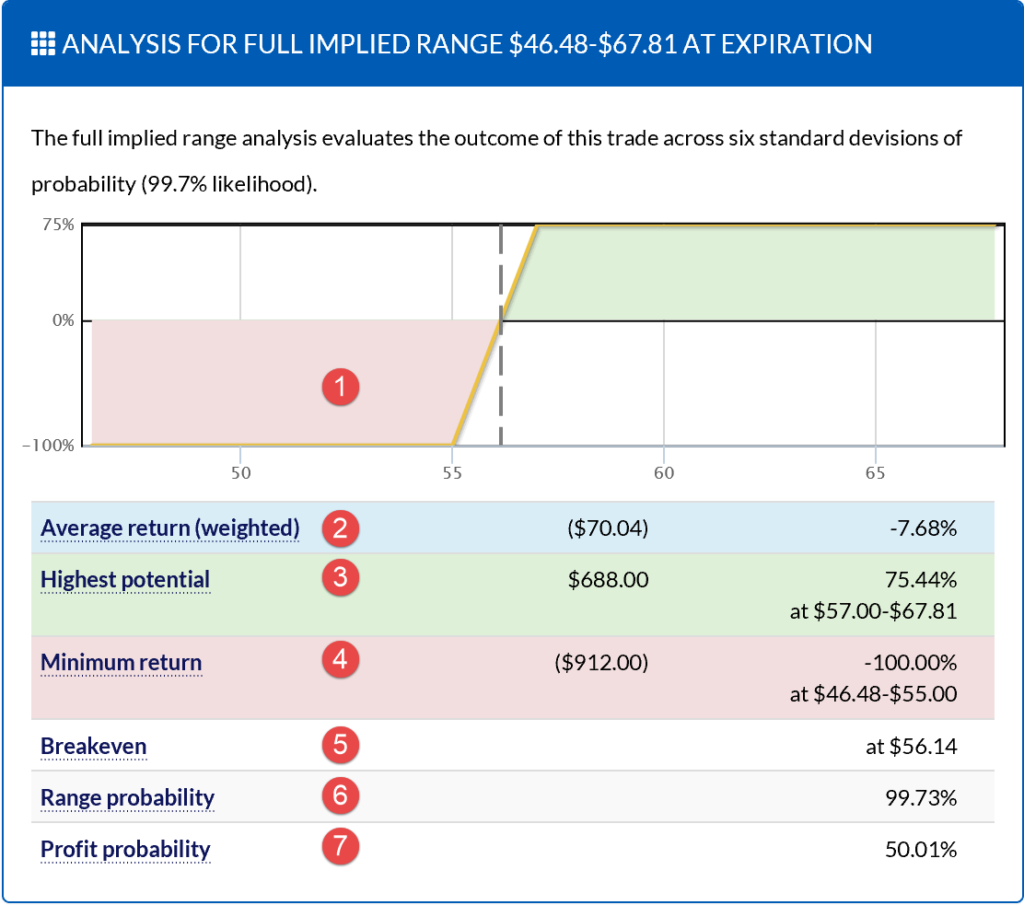
The Full Implied Analysis panel analyzes the expected performance of the trade at expiration for a six-standard-deviation range. This range has a 99.7% likelihood based on the implied distribution. Note that this analysis is based on intrinsic value and does not take into account extraordinary circumstances, such as early option assignment.
- The profit and loss chart.
- The weighted return for the full implied range. All prices are weighted based on their relative probability.
- The highest potential return for the full implied range.
- The lowest potential return for the full implied range.
- The breakeven points within the full implied range, if any.
- The likelihood that the underlying will close in the full implied range based on the implied distribution.
- The likelihood of profit for this trade if the underlying closes within the full implied range.
Profit Density
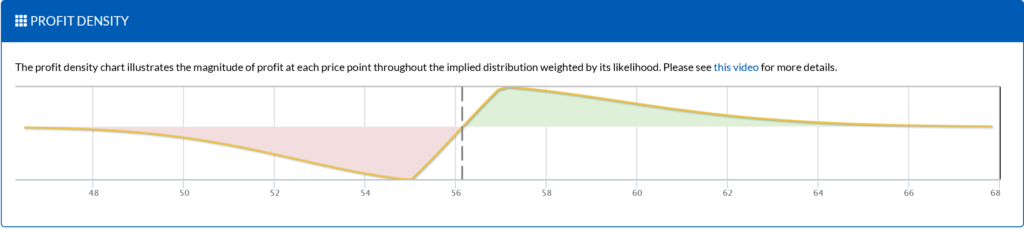
The Profit Density chart provides a view into the potential profit and loss for this trade where the return at each price is weighted by its relative probability. This view provides an easy way to see where the true risk and reward opportunities lie.
The video below discusses an example.
Volatility Skew
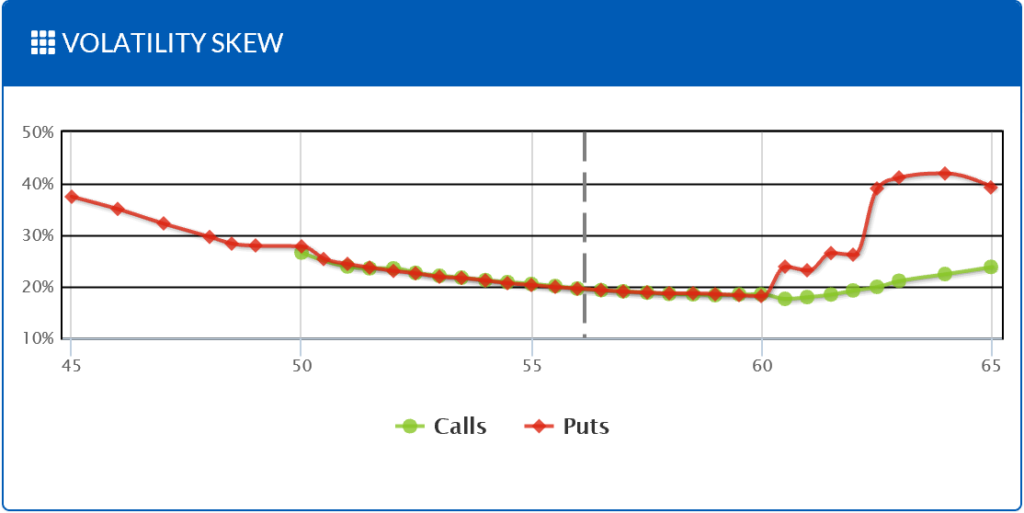
The Volatility Skew panel charts all available implied volatilities for this expiration. The implied volatility skew can provide insight as to the market’s expectations for the underlying.
Model vs. Implied Distribution
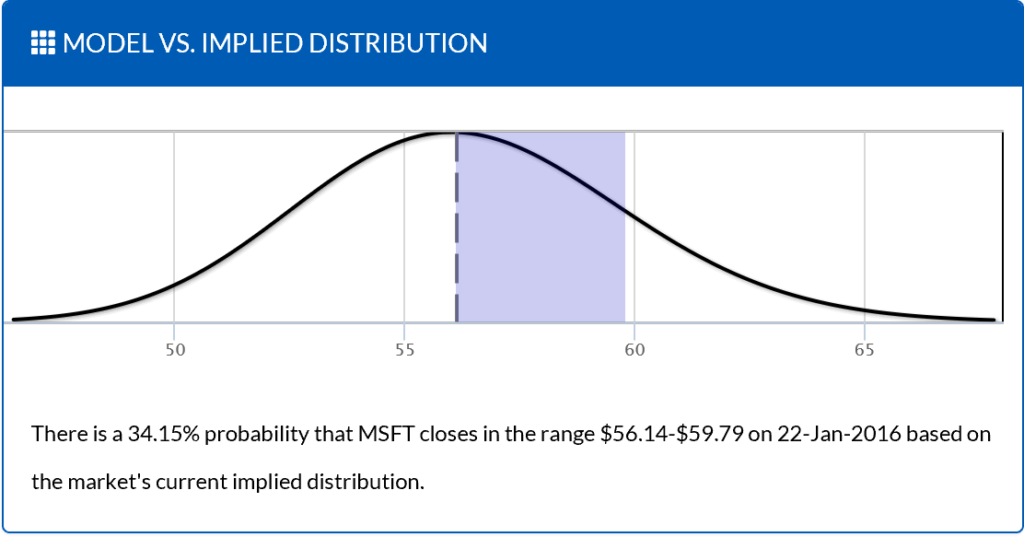
The Model vs. Implied Distribution panel shows how the model price range maps to the implied distribution. This is a helpful way to determine if the price target being considered is likely based on market pricing.
Trade Greeks
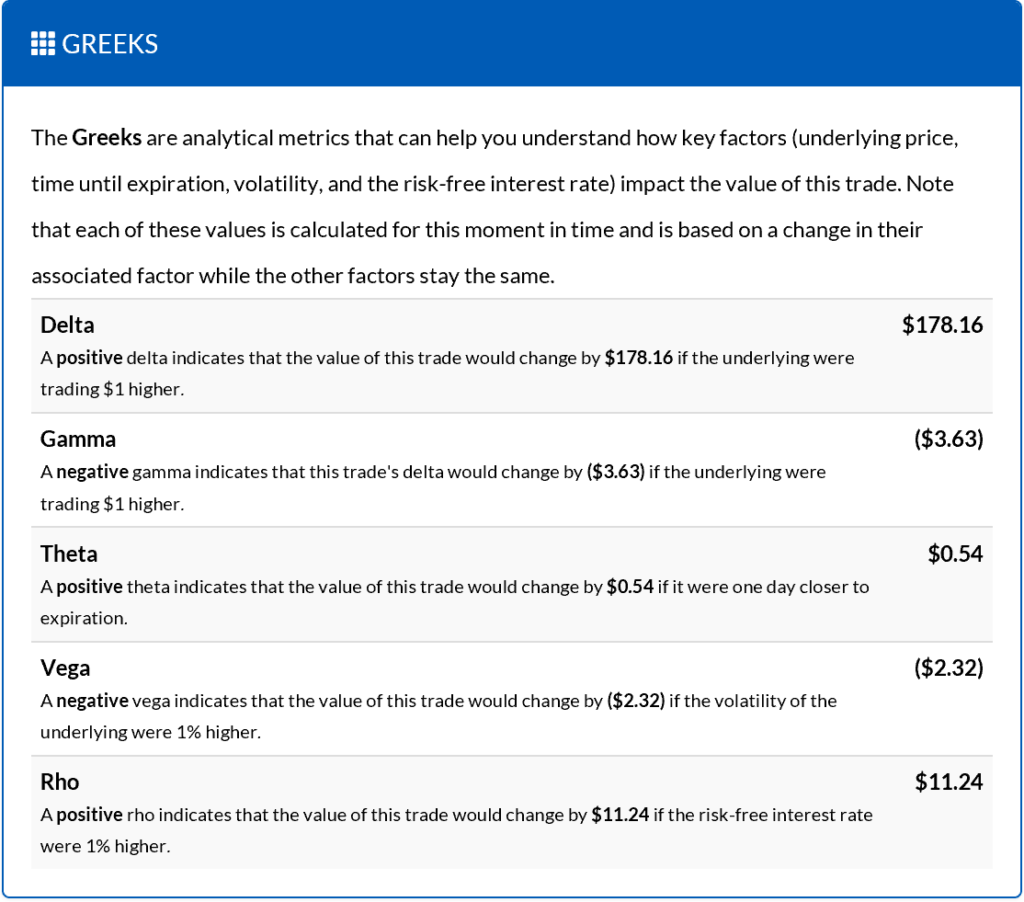
The Greeks panel provides a compiled set of greek analytics for this trade. These details can help you understand how the trade may react to changes in the underlying’s price and volatility, as well as its sensitivity to the time remaining until expiration.