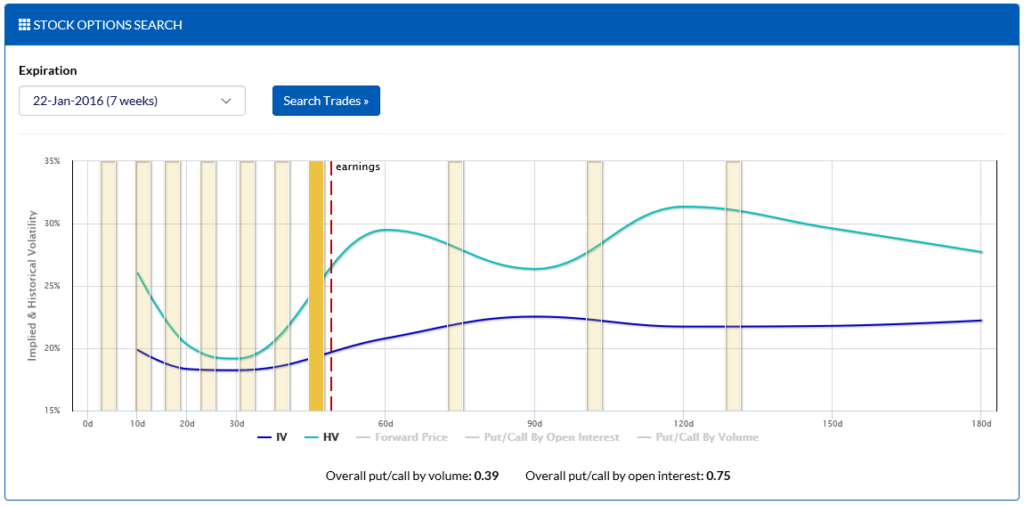
The stock overview provides a wealth of data about a stock and its options. At the top of the page there is a chart that presents key data for the stock, overlaying its option expiration dates on top of its historical volatility, implied volatility, forward pricing, and put/call ratio data. You can learn more about this chart over on the Expirations Chart page.

Clicking on one of the expiration bars will begin the search process for trades expiring on that date. Alternatively, you can select the option expiration (including those more than 180 days out) from the dropdown box.
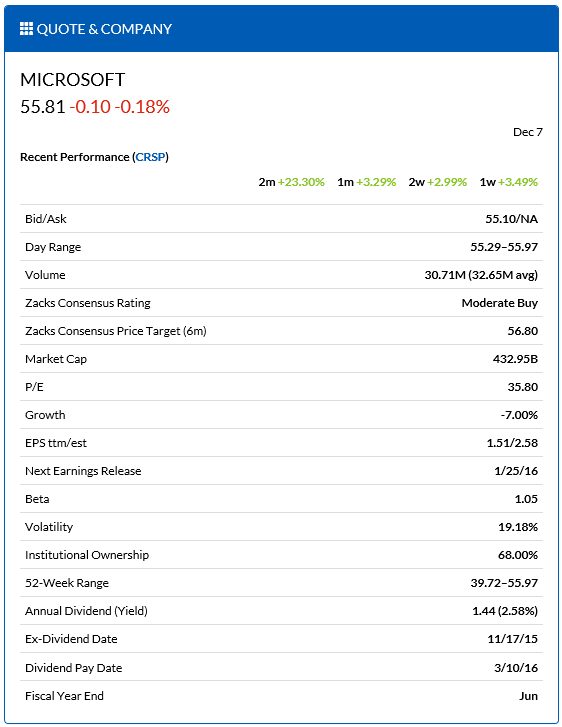
Further down on the page you will find a mix of stock fundamental and quote data.

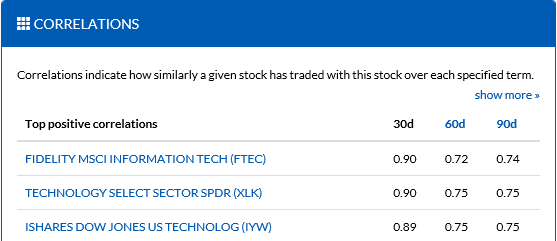
You will also find correlation data indicating the stocks that have traded most and least similarly to the current stock over the past 30/60/90 day terms. Note that this data is EOD data from the most recent trading day.
