Exercise: Filtering, sorting, and understanding search results
The options search engine evaluates prospective trades using the provided model. Those trades are then filtered and sorted based on the configured settings.
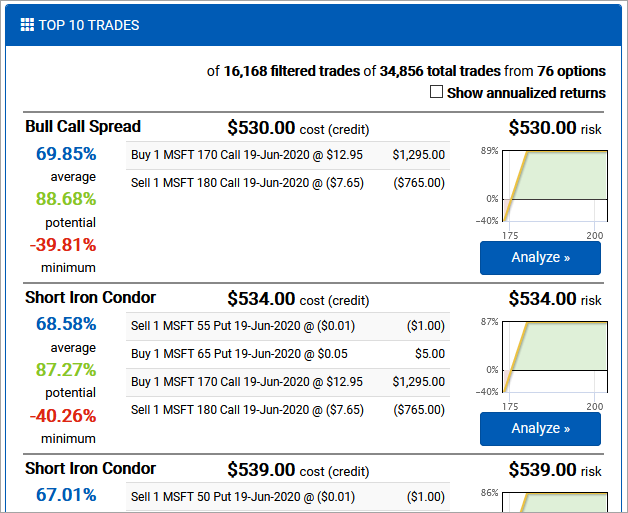
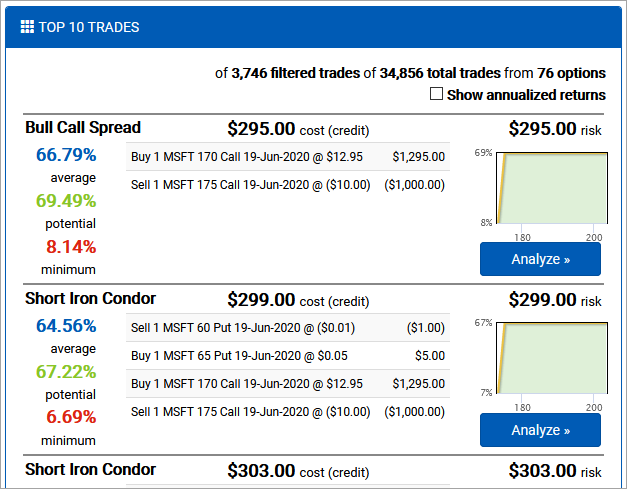
Observe the list of over 16,000 trades shown for the current model, filters, and sorting. The top trade is a Bull Call Spread followed by two Short Iron Condors.
Sorting trades
Trades can be sorted using the Sort By dropdown. There are three ways to sort, but it’s important to understand that all sorting is done relative to the model provided. As a result, search results can change if you change the target price range, commission structure, or pricing strategy (market vs. midpoint).
- Average return sorts trades by the average expected value of the trade within the model’s price range.
- Highest potential sorts by the potential return for the trade within the model’s price range.
- Lowest risk sorts by the lowest return for a trade within the model’s price range.
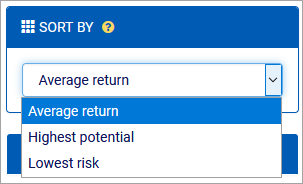
Change to a different sorting and observe how the results change. Select Average return sorting before moving on to the next step.
Filtering trades
Filtering trade strategies
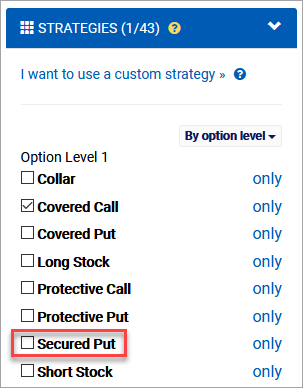
The options search engine supports several dozen common and complex option strategies. You can configure them one by one, or scope into a single strategy. For example, you may be looking for a trade using a specific strategy.
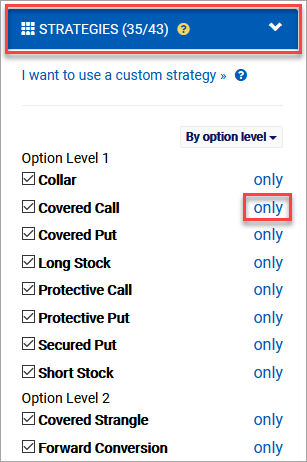
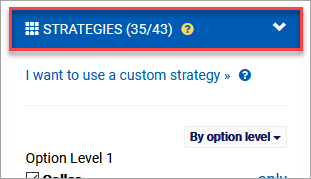
Click the Strategies header to expand that section. Due to its length, this section is collapsed by default.
Click the only link next to Covered Call to filter out all trades that are not covered calls.
Unlike the model designer, filter and sorting changes update the trade list immediately.
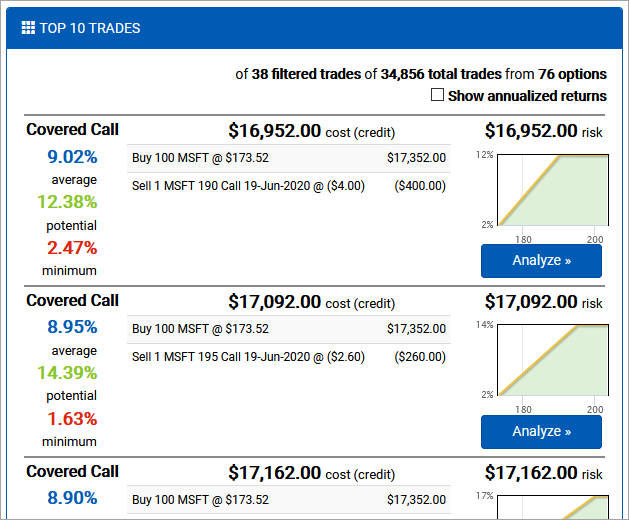
Observe the updated list of trade results, which is now filtered down to 38 covered calls.
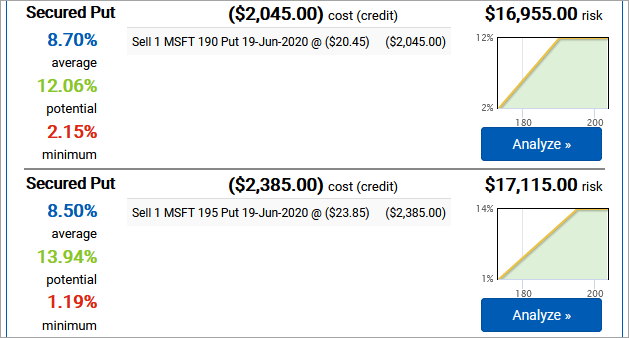
Add secured put trades to the list by checking its box in the strategy filter.
Observe the addition of secured puts to the trade results. They begin at the 4th & 5th results.
Missing trades?
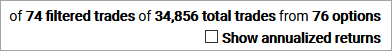
Covered calls and secured puts are generally considered to be symmetrical trades. They offer the same payoff diagrams and are often used as swappable strategies. When we filtered down to just covered calls, it made sense that there were 38 trades since there are 38 calls (half of the 76 options). However, something doesn’t add up here since showing both covered calls and secured puts should produce one trade per option, but we’re seeing fewer.
Observe the filtered trade count (74) is less than the number of options (76).
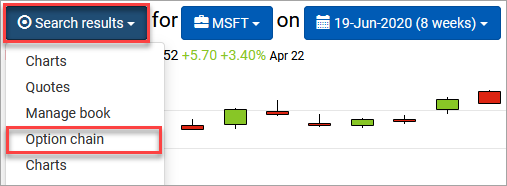
It looks like there are two missing secure put trades. When this happens, it’s usually because of option pricing. One way to dig into the problem is to take a look at the option chain. The tool dropdown in the breadcrumb at the top of the view makes it easy to jump to related tools.
From the Search results dropdown, select Option chain to open the option chain.
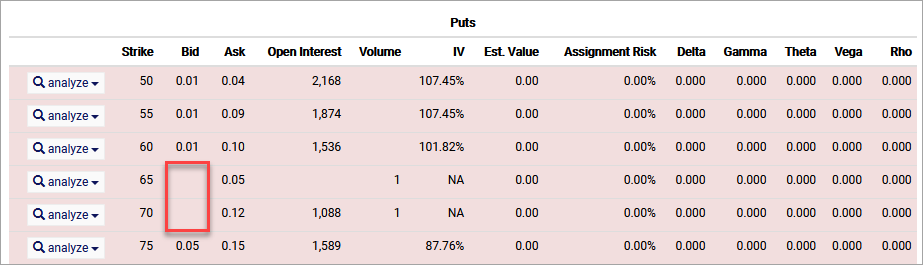
Scroll down to the Puts and observe that two strikes (65 and 70) have no bid, which means secure puts cannot be modeled for them.
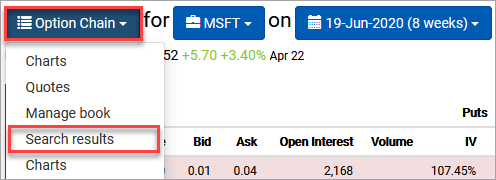
Use the Option chain dropdown to return to the Search results.
Filtering strategies by option level
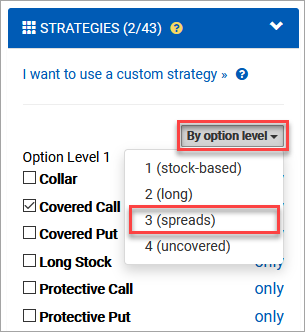
You can use the By option level dropdown to include only trades that match your approved options trading level. While these levels may vary slightly across brokerages, they generally translate to the degree of leverage risk you’re comfortable working with.
- Level 1 covers stock-based strategies, such as covered calls and secured puts. Every option position is covered by the full cost of the appropriate number of shares, so leverage risk is limited by the number of shares you can buy now.
- Level 2 covers naked long option positions. These positions are “naked” because they are not hedged with offsetting short positions. The leverage risk is limited to the number of options you can afford to buy now.
- Level 3 covers spreads, which are combinations of long and short option positions. Since the debit or margin requirements of these can be reduced significantly by strike selection, they open up a lot of leverage opportunity. This opportunity leads to significant risk potential as a high quantity of a tight spread trade can lose a lot of money very quickly.
- Level 4 covers uncovered option positions, otherwise known as naked shorts. If you are cleared to sell naked puts at this level, you’ll be required to maintain less margin than a secured put, which introduces a leverage opportunity. Any strategy with a naked call is theoretically unbounded in its loss potential.
You can select option strategies using the By option level dropdown. This includes all strategies at that level, as well as the strategies at levels below it.
From the By option level dropdown, select 3 (spreads). This will include everything except the level 4 strategies., which was the original list of trades.
The I want to use a custom strategy sends you to a long stock trade in the trade analyzer. You can then adjust the legs however you like to model the performance of a trade with any combination of legs.
Select the Strategies header to collapse it. This will make it easier to work with the other filters.
Filtering returns
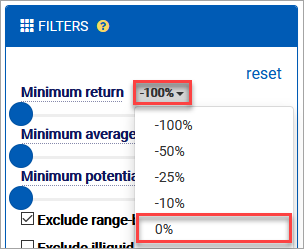
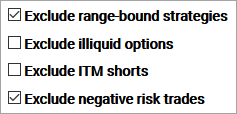
Prospective trades can be filtered based on their expected returns. By default, all filters are set to -100%.
If you have a view with a precise price range, you may only want to see trades that would turn a profit for prices within that range. This is especially useful when evaluating range-bound strategies like condors and butterflies. However, it can be just as helpful for directional views when range-bound strategies are filtered out.
From the Filters section, select 0% from the Minimum return dropdown.
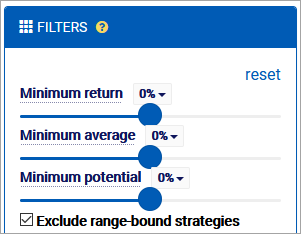
Due to the way these returns work, the average return will always be at or above the minimum return, and the highest potential return will always be at or above the average return. As a result, other sliders may be moved when one is pushed past their current value.
Observe that all minimum returns have been pushed up to 0%.
Observe that the search results now reflect only trades that only produce a profit within the model price range.
Filtering other trade details
You can also use filters to adjust results based on common requirements. For example, when you loaded the original search with a bullish view, the engine set the Exclude range-bound strategies filter to remove trades that would turn a loss if the stock moved too far up. You always have the option of turning this off in order to see those other trades, but by default they would be hidden since bullish views typically don’t want to risk losing money on a trade if the stock surges beyond their expected price target.
Understanding trade results
The trade results presented in the list all share the same structure with the same general details.
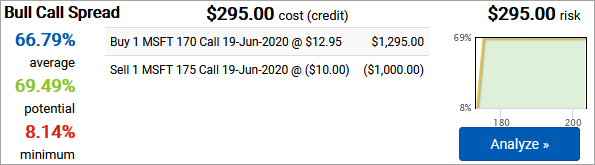
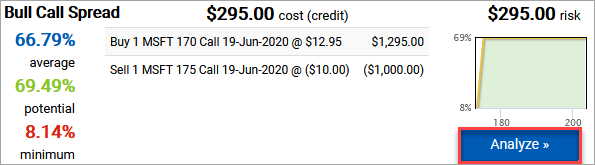
- The top row consists of the name of the strategy, followed by the cost or credit to open the position. Numbers use accounting formatting, so $123 is a debit and ($123) is a credit. The trade above costs $295 to open.
- The final item in the top row is the total risk for risk-defined trades or the margin requirement for trades with one or more uncovered legs. Since it is a debit spread, the cost to open, $295, is the risk.
- The returns shown on the left side of the result are relative to the model’s price target range. These are the values used when sorting the results. If the trade closes in this range, it will return at least 8% and up to nearly 70%. The average expected value, which is the probability applied to each terminal price, is almost 67%. Note that all of these returns are based on the intrinsic value at expiration and do not factor in liquidity, commissions, or fees related to closing the position.
- The trade entry plan is listed in the middle of the result. It includes all of the information about the option, side, and pricing used for evaluation. This trade involves buying the 170 call and selling the 175 call.
- The profit & loss diagram on the right side of the result projects performance within the model’s price target range. You can click on it, or the Analyze button, to send it to the trade analyzer for further review.
Select Analyze for the first trade result to view it in the trade analyzer.