
Exercise: Reviewing a trade in the trade analyzer
The trade analyzer provides a risk-neutral review of the trade under consideration. It is designed for use with strategies where all options expire on the same date. These strategies may or may not include an equity position.
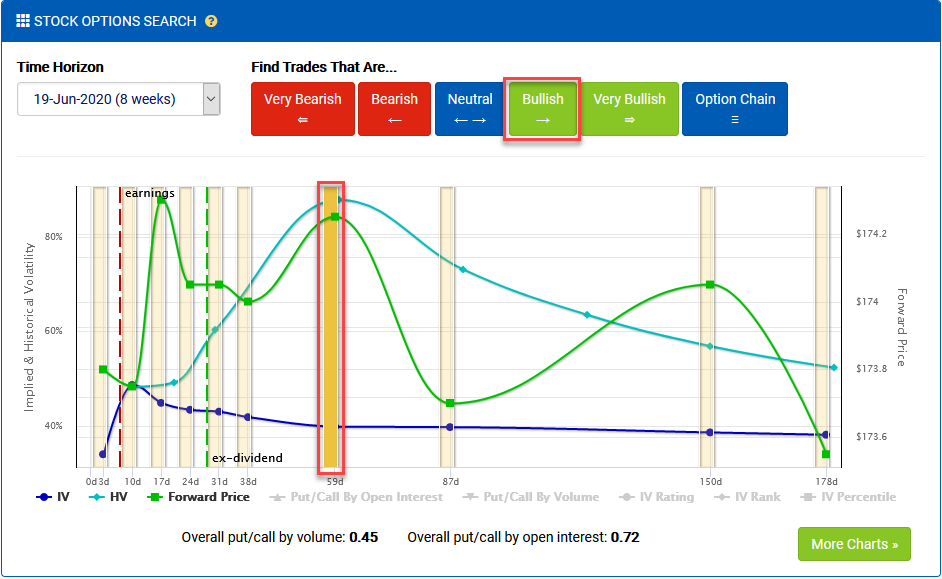
The top section of the trade analyzer works in the same way as the options search engine. You can use the model designer to adjust the price range and other parameters, which are then applied to the current analysis.
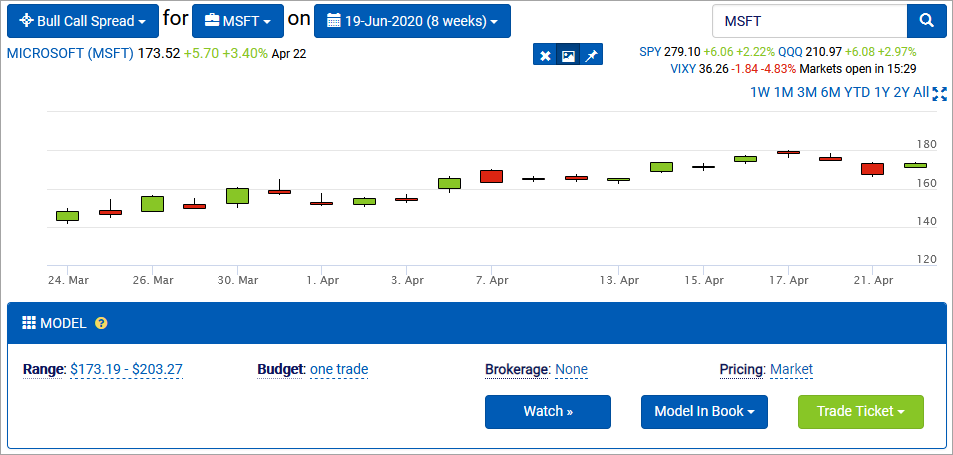
The trade analyzer’s model designer includes three additional features:
- The Watch button adds the trade to your watchlist so you can track its performance.
- The Model In Book dropdown provides an easy way to send this trade to the book manager. Once there, it’s added to the pending book for further review.
- The Trade Ticket dropdown provides an easy way to send this trade to the integrated trade ticket. Note that this option is only available when working from a subscribed account that’s linked to a brokerage.
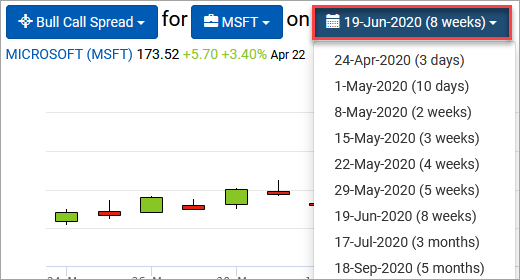
You can also change expirations using the expirations dropdown in the breadcrumb. If the same option strikes are available for that week, it will change the analysis to use them. Otherwise it will bring you to the option search for that date.
Risk-neutral trade review
The risk-neutral trade review analyzes the trade for a variety of conditions and metrics that can help uncover potential risks. It’s like an executive summary for the trade idea.
Scroll down to the Risk-neutral trade review.
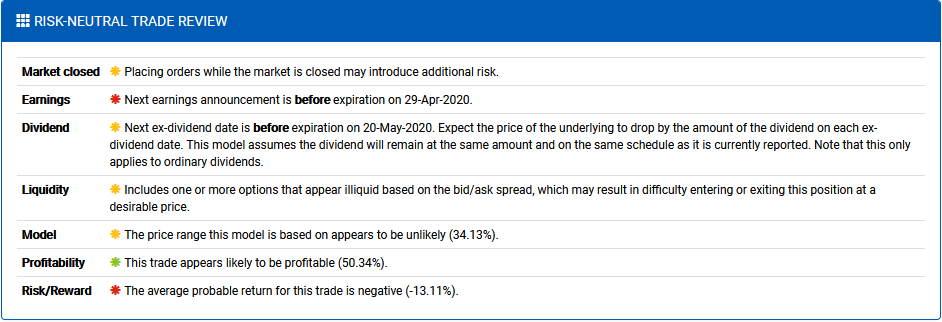
The trade review checks for a range of different scenarios:
- Orders placed when the market is closed can be risky, especially if they’re market orders.
- Trades with expirations occurring after expected earnings announcements are subject to increased volatility.
- Trades with expirations occurring after expected dividends require consideration around the forward price, as well as the risk of short calls being assigned if in the money.
- If the dividends are being estimated for the expiration due to a lack of reliable data, a warning is raised.
- Trades analyzed using midpoint pricing may not show practical results.
- Trades with illiquid options may be difficult to enter and exit at a fair price. Illiquid options are those with more than a .05 spread between the bid and the ask and where the bid is more than 5% below the ask.
- The model’s price range is evaluated for probability based on the implied distribution. The tolerance for this probability will vary by trade circumstances, but it’s important to consider before entering.
- The probability of profit for the trade indicates how likely the trade is to turn a profit based on terminal price probability, regardless of the size of the profit. This metric is calculated using the entire implied distribution and not just the model’s price target range. It’s typical for directional trades to be well under 50%, but always be wary of trades with very low probabilities relative to their potential return.
- The risk/reward ratio of the trade represents the expected value of the trade based on the probability of returns at each terminal price. This is also calculated using the full price distribution and not just the model range.
- If the trade includes naked short positions, there are different warnings for calls, puts, and stock.
- If the stock appears to be hard to borrow, then it may be poised to behave erratically.
- If the trade loaded has a risk beyond the supplied budget parameter, a warning is raised.
- If there is negative risk, a warning is raised that the trade appears to be arbitrage and the return should be checked against alternative risk-free investments.
- There is also a catch-all warning for potentially invalid trades. While we do everything we can to provide quality analysis, sometimes the data produces trades that are infeasible, so we raise a warning.
In this exercise, the main concerns about the trade being reviewed are that there are both earnings and dividends occurring prior to expiration. However, this was already known back when the expiration was selected in the stock overview.
Entry plan and risk
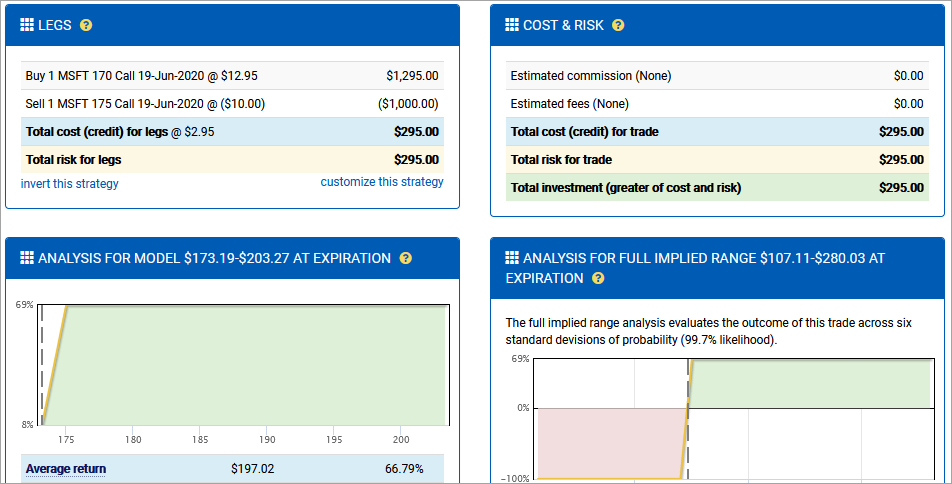
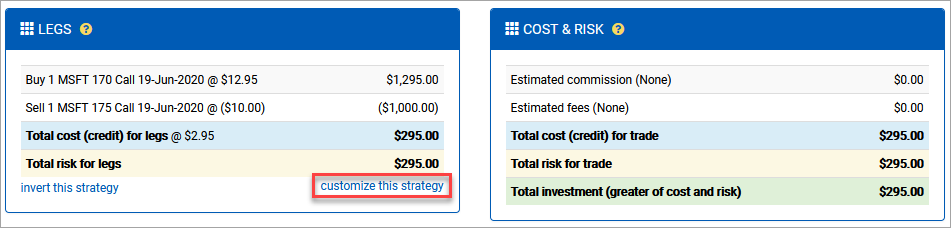
The next section of the trade analyzer covers the trade entry plan and related risks. The Legs section is specific to the legs of the trade, while the Cost & Risk section factors in commissions and fees to produce a final investment risk.
Scroll down to the Legs section.
Select customize this strategy.
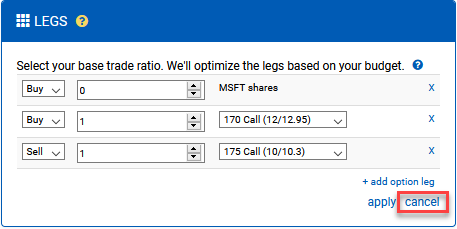
If you would like to experiment with leg adjustments, such as trying out different base ratios or additional legs, you can do that here. The ratio you supply will be reduced to a base ratio and then scaled up to meet your budget parameter.
Select cancel to hide the leg customization.
Profit & loss diagrams
The trade analyzer offers side-by-side profit & loss diagrams that cover both your supplied pricing model as well as a full implied range. The purpose of these two models is to offer one view of performance for your projections, as well as the full story of expected outcomes that may work against your trade.
Scroll down to the Analysis sections.
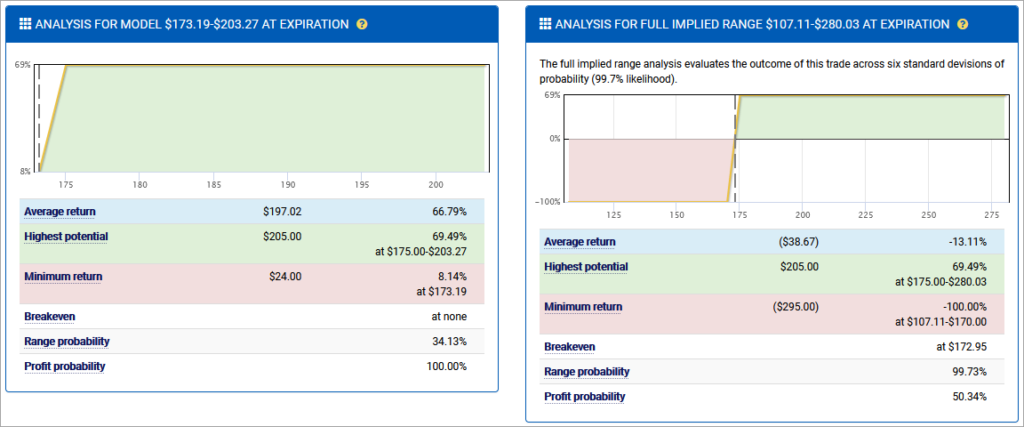
As expected, the trade will perform wonderfully if the terminal price lands in the modeled range. However, that’s by design. We explicitly filtered out any trades that offered below a 0% return in the option search. That’s also why there is no breakeven price in the model’s analysis.
The full implied range, on the other hand, tells a different story. It uses a model that includes six implied volatility movements (down three to up three) to produce the nearly 100% expected range. It offers a breakeven price that’s slightly below the model’s lower bound and also shows that there is real risk if the underlying drops too far.
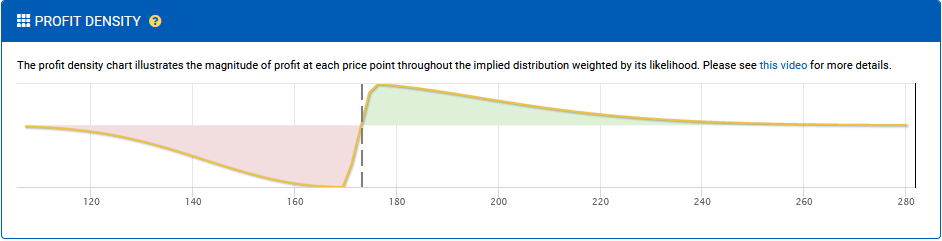
Profit density diagram
To better visualize the profit & loss potential of the trade, the trade analyzer includes a profit density diagram. This diagram marries the profit and loss diagrams with the implied distribution to produce a visualization of the profit magnitude at each terminal price.
Scroll down to the Profit density section.
Greeks
The Greeks are a set of metrics that measure how sensitive option prices are to changes in the factors that drive them. Delta, for example, measures the price change for an option if its underlying were trading $1 higher. A full discussion of the Greeks is beyond the scope of this exercise.
Scroll down to the Greeks section.
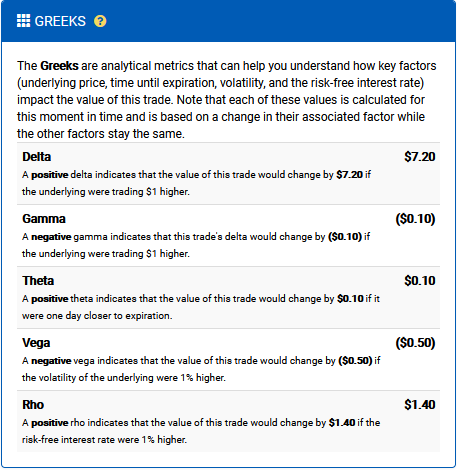
The Greeks for this trade are in line with expectations for a bull call spread. Delta is positive, which is to be expected for any bullish trade. The other Greeks are generally negligible, which is common for a spread like this. However, this could be particularly useful information if you are planning this trade in the context of other positions.
Important caveats
The trade analyzer evaluates the returns for the trade at expiration. However, this includes some assumptions that don’t always play out.
- It does not account for liquidity costs in closing legs. All returns are based on the cash settlement of intrinsic value.
- It does not include exercise or assignment fees for option legs that close in the money at expiration.
- It does not consider early assignment. If being assigned options results in a dividend being received or owed, that is not included in the analysis.