
Exercise: Working with the model designer
Launching a trade search instructs the options search engine to generate, filter, and sort prospective trades based on the configured settings.
Generating trades
The options search engine exhaustively generates as many trade ideas as possible using the options available. It applies dozens of strategies that span the vast majority of option trading scenarios.
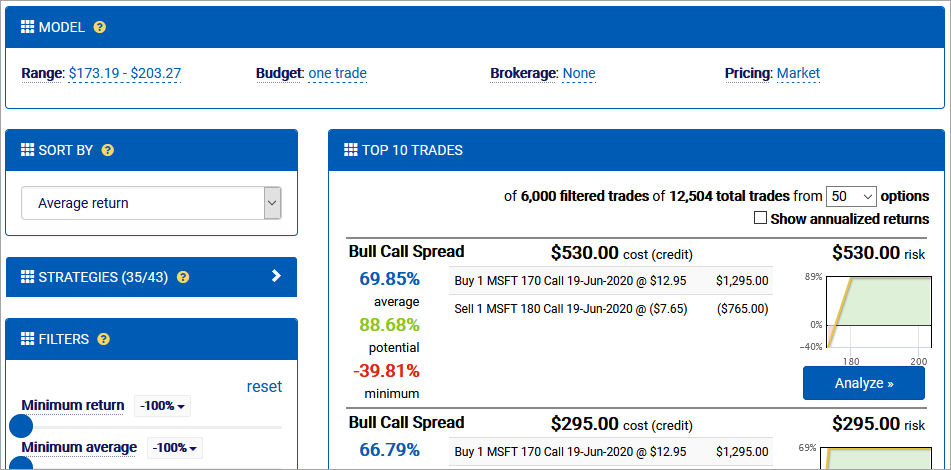
Observe the trade counts from the top of the search results (Top 10 Trades) section.
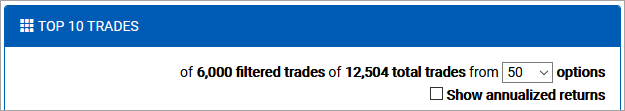
Using the 50 selected options, 12,504 trades are generated. After the default filters are applied, around 6,000 trades remain. Note that this number may vary as more strategies are added to the option search over time.
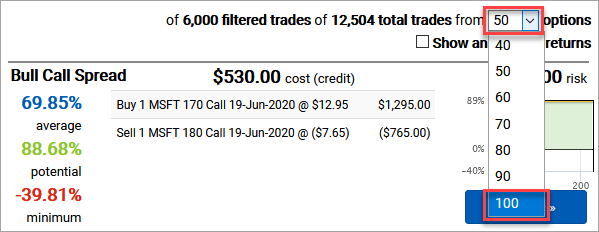
If an expiration offers more than 50 options, the engine selects the 50 most relevant to the current model to optimize for performance. These options include strikes near the money, near the edges of the price model, and a distribution of other options designed to produce a broad array of prospective trades. You may expand this set up to using the option count dropdown if a broader search is required.
From the option count dropdown, select 100.
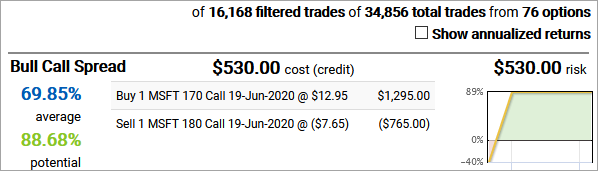
As there are only 76 options available for this term, all will be used to generate trades. Adding these additional 26 options has nearly tripled the number of trades modeled to around 35,000. However, the relevance of newly added trades will vary based on your goals and other parameters.
Designing a model
Once all prospective trades have been generated, they must be evaluated to determine their potential returns. This requires a model, which is the set of parameters used to price the trade at entry and exit.
There are four parameters that can be adjusted in the model:
- Range specifies the price range to evaluate trades at expiration. Trades in the options search engine are evaluated at their intrinsic value.
- Budget indicates the maximum risk to assume for a given trade. This risk is used to scale trades to their maximum leg quantities such that they use as much of the budget as possible. When 0 is provided, each trade is assumed to have its minimum quantity.
- Brokerage specifies the commission structure to apply to the trade entry.
- Pricing specifies the prices to use when opening option positions. Market assumes long positions are bought at the ask and short positions are sold at the bid. Midpoint assumes all positions are traded at the bid/ask midpoint.
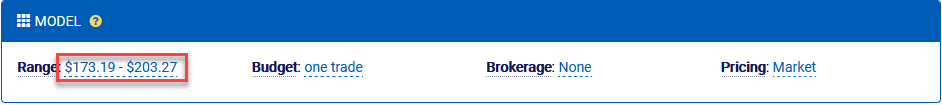
You can edit the current model by clicking any of the current parameters.
Select the current Range to open the model designer.
Model designer
The model designer allows you to update the model used when evaluating trades. Changing settings for budget, brokerage, and pricing are straightforward. However, the real art to building a model is the details of crafting the price target range. There are limitless ways to develop a precise model from your underlying view, and the model designer provides a wealth of data to help you in the process.
Immediately below the parameter edits is a set of option analytics specific to the current term. These data points are helpful in crafting a model for the pricing based on implied volatility, put/call ratios, forward prices, and option breakevens. The percentages next to the forward price and breakevens represent the difference between the current underlying price and that analytic.

Below the analytics is the visual option chain. This chart presents all relevant information from the option chain in one consolidated view.
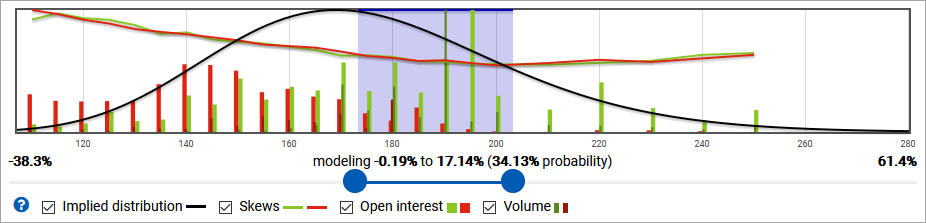
- The black curve represents the implied distribution, which is the relative probability of each terminal price at expiration based on the implied volatility.
- The greed and red curves represent the implied volatilities of calls and puts, respectively.
- The wide and light green and red bars at each strike represent relative open interest. For this term, you can easily see that the most call open interest is at the 195 strike, whereas the most put open interest for puts is split between 140 and 150.
- The narrow and dark green and red bars at each strike represent the current day’s volume of traded calls and puts, respectively. It appears that around three quarters of the options traded today were calls, and most of those were at 190.
The most obvious option for adjusting the target range is to manually input high and low prices. You can also use the range slider under the visual options chain to adjust the range to include or exclude strikes. This is the easiest way to model a target range based on an absolute percentage move.
Drag the range slider around to select a new view with a range of around 180 to 200. It doesn’t need to be exact.
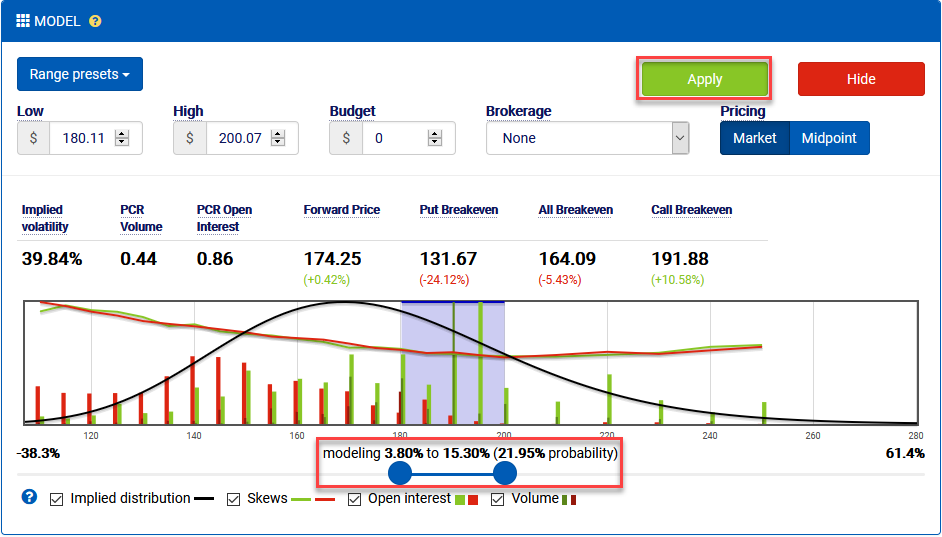
This range is tighter than the original range, so the probability is lower that it will ultimately be correct. Also observe that the Apply button appears. You can make any changes you like in the model designer, but they will not be applied until you click this button. If you want to revert changes, just click Hide. You don’t need to click either just yet.
Sometimes it’s not easy to determine the magnitude of a move to expect. To help with this, the model designer provides some range presets. These presets use hardcoded movements based on the implied volatility for the term.
For example, when you clicked the bullish button on the stock overview, it preconfigured the search to use a moderately bullish view of a price range of a move between 0 and +1 standard deviations (implied volatilities). That’s why the default price range is $173.19-$203.27. The annualized implied volatility for this term is around 40%, which translates to a periodic implied volatility of around 17%. That’s how the engine arrived at the price model it’s using for this search.
As a quick side note, you may notice that the lower bound of the price range is a -0.19% move. It’s negative because the stock is issuing a 0.51 dividend prior to expiration. The forward “0-vol” movement represents the current price (173.52) minus the dividend (0.51) plus the risk-free interest rate-driven appreciation (0.18). This can be viewed as a natural forward price (as opposed to the options-implied forward price discussed earlier).
Expand the Range presets and note the IV movements associated with each preset. Select Moderately bullish.
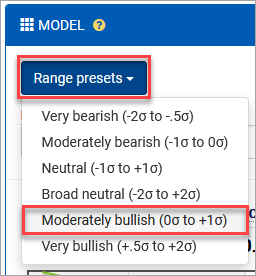
This preset matches the model to the original range it loaded with, so the Apply button will disappear.
Range presets are provided as a convenience to jumpstart the search process. You will likely want to use the information from your underlying view and the option analytics to tweak the range to best fit your expectations.