Exercise: Opening the options search engine
Prerequisites
Before beginning, please read this article on setting up your environment for course exercises. This brief article is necessary to understand the requirements below:
- This course includes a series of exercises that form a complete story. Work through them in order and do not reset your environment between exercises since each one picks up where the previous left off.
- This exercise begins on the Quantcha Options Suite dashboard. You should be logged out from the Quantcha Options Suite, preferably in a private browser window.
- It is recommended that you remain logged in to Quantcha Docs (this site) in order to track progress.
Scenario
In this scenario, you will play the role of an investor looking to express a bullish view on MSFT. You will use the options search engine to find a trade that meets your risk/reward goals.
Opening the options search engine
The dashboard is the default landing page. It provides a starting point to access key functionality, including your portfolio, screeners, charts, and more.
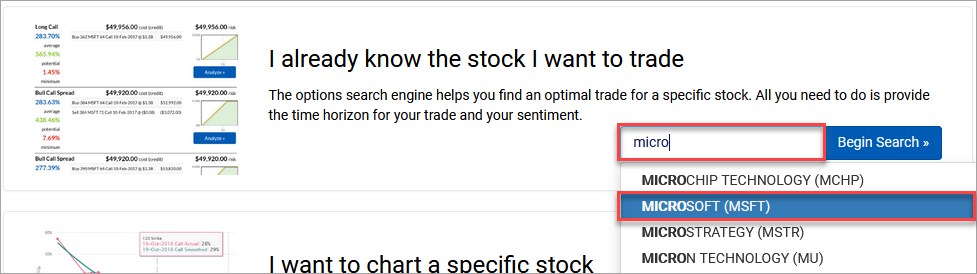
Locate the section that says I already know the stock I want to trade. This is the path to get to the overview for a specific stock.
Start typing “microsoft” and select the MSFT stock when it appears.
Stock overview
The stock overview page loads for MSFT. This page provides a wealth of information about the underlying across all terms. Let’s take a moment to walk through each section.
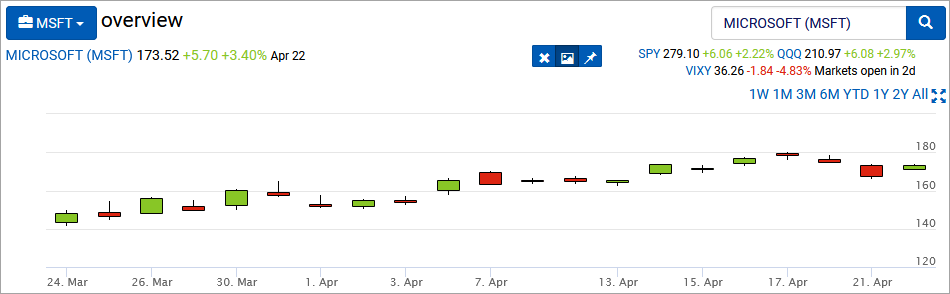
The top section includes key market data for review. This includes a breadcrumb button for each navigation to other views relevant to the stock, such as charts and the book manager. You can also adjust the term of the quote history. For linked brokerage accounts that support minute bars, you have additional options to scope into the current day or hour.
Scroll down to the Stock Options Search section.
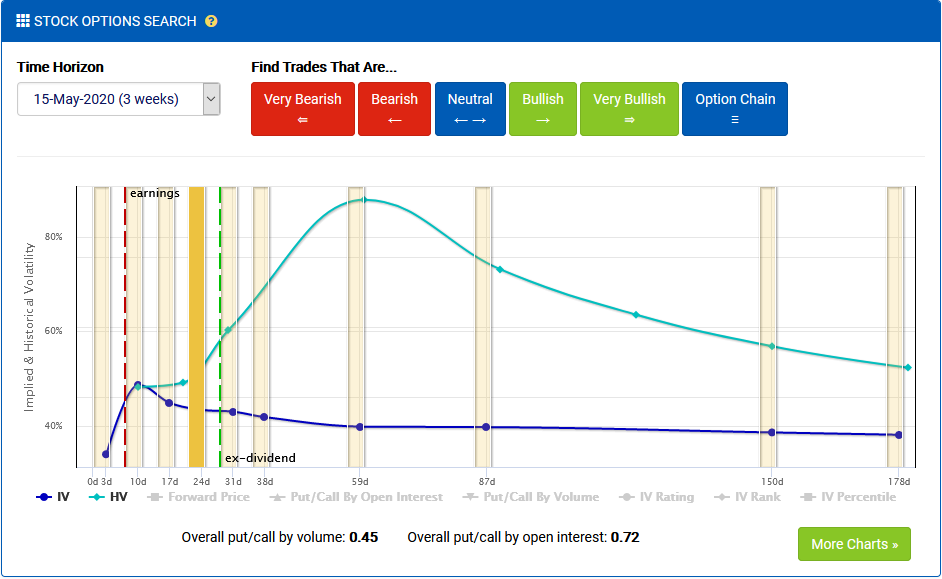
This section provides a wealth of options-centric data about the stock projected against the various option expiration terms. It also offers buttons to launch a sentiment-driven search, as well as access to the option chains for each expiration. We will return here after reviewing the rest of this page.
Scroll down to the Quote & Company and Correlations sections.
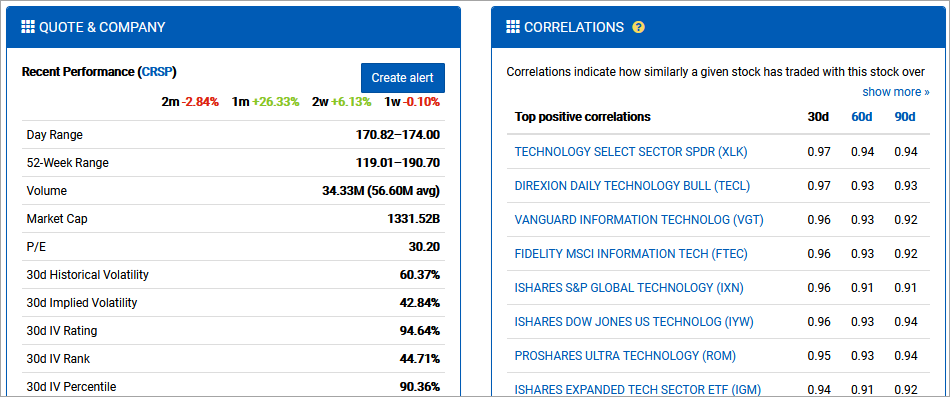
The quote & company section provides some glance information about the recent performance of the stock, as well as fundamentals. You can find important information, such as implied volatility valuations, earnings dates, dividend details, and more.
The correlations section provides a snapshot of other stocks that have traded in a correlated manner. In the case of MSFT, the highly correlated stocks tend to be ETFs that include MSFT as a significant holding. Similarly, the lowest correlations are from bearish technology ETFs that are short MSFT. This section can be useful to get an idea of how a stock trades, especially if you’re not very familiar with it. Stocks tend to correlate based on a variety of factors, including sector, geography, and more.
Scroll back up to the Stock Options Search.
A full discussion of the data available in this section is beyond the scope of this exercise, but it’s important to understand the breadth and depth of insights available. To learn more, read about the expirations chart.
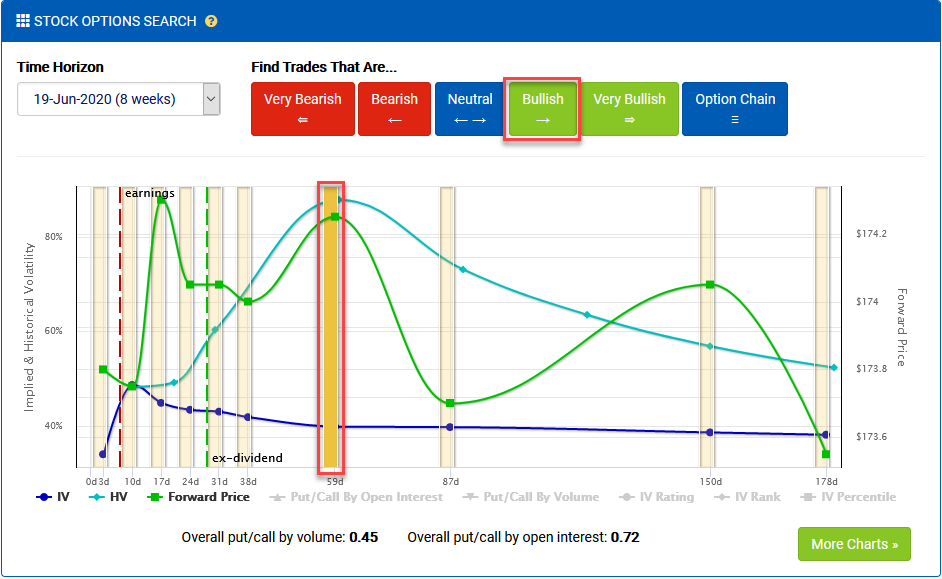
In this exercise, we will add the forward price to the chart. Alternatively, any of the other ratios or valuations could be included.
Select Forward Price from the legend to show its option-implied value over time.
Hover your mouse (or tap on) the value at the 59-day mark. This will display the forward price for that term. It will also display any other enabled values set for that term, such as the implied volatility.
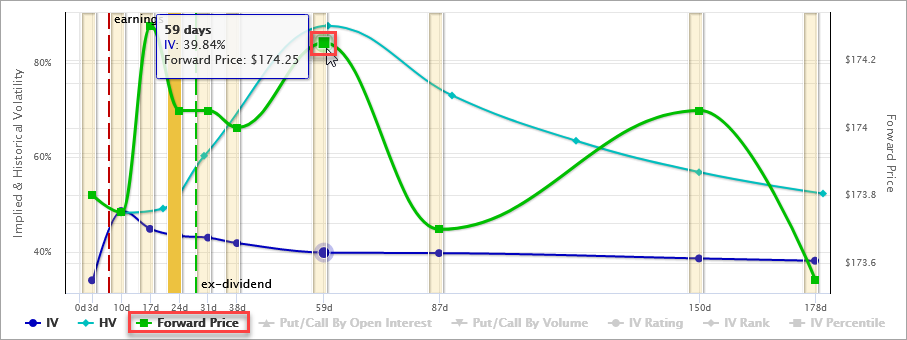
As a refresher, the forward price is the breakeven for a synthetic long stock position made up of a long call paired with a short put. It offers insight as to the price the options market projects the stock to trade at in the future. In this case, the markets appear to be pricing the stock’s future from 173.55-174.30, which doesn’t raise any concerns relative to the current price of 173.52. Had the forward price been lower, such as below 170, we might double-check the underlying view research to see if there was some bearish evidence being overlooked.
Select the expiration set at 59 days from today. Note that this also updates the Time Horizon dropdown to select June 19 .
To begin the trade search, select the Bullish option from the top of the section.