
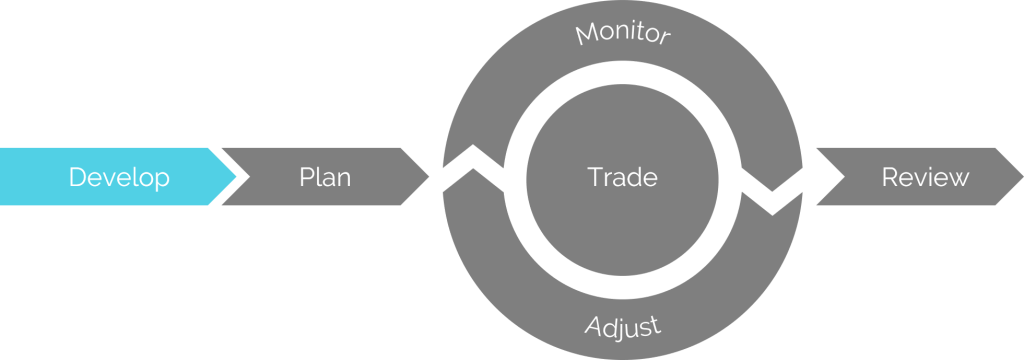
Scenario: Develop
Tuesday, June 30 @ 10:47 AM
As Mark scans his watchlist, he notices that XYZ is up again today. It’s only up about one percent, but it’s been consistently green for the last week or so. He started watching it a couple weeks ago when someone mentioned it had posted a golden cross. He never was much for technical analysis, but it seemed like these moving averages were telling a positive story, so he started tracking it. Now he’s convinced that this might be an opportunity he wants to pursue.
He’s been through the Getting started with InvestOps course, so he knows that the first step is to develop a view. He’s had tons of investment opinions before, but he’s never really bothered to formalize them beyond writing down a few notes. Something looked good, so he bought it. When he changed his mind, he sold it. It usually worked, but he always had some doubts about whether it was the right approach for the long run.
Since he doesn’t have a formal process for creating a view, Mark decides to download the View Development Worksheet. He recognizes that it provides a solid foundation for structuring his thoughts about this potential investment, so he starts filling it in. As he puts his notes together, he begins to ask himself important questions about his view.
Researching the view
Mark is initially bullish about the stock, so he starts working on some independent research. He notices that XYZ’s earnings announcement is coming in about three weeks, and he’s not sure if he wants to hold a position through that uncertainty. Historically, it looks like the stock moves up leading into earnings announcements, but post-earnings performance has varied based on the earnings report.
As he looks into some peer stocks, he observes that this stock seems to be undervalued relative to the P/E ratios of its peers. He infers that this could drive a near-term rise in the price as other investors turn their attention to the stock leading into earnings. There could be a great short-term opportunity here.
As a final safety check, Mark looks into the option analytics. Unusually high implied volatility (IV) could be interpreted as a sign of risk overlooked somewhere along the way. However, reviewing the IV history indicates that the options are trading about where they usually do at this point in the cycle. IV Rank and IV Percentile are both around 50, so it doesn’t seem like investors are concerned with any extraordinary risk at the moment.
Mark’s view development worksheet
After spending some time researching and refining the view, Mark ends up with a worksheet like this one. Now it’s time to move to the next stage to see how this view can be expressed.